How to wrap text in column headings in Excel

You can save yourself time scrolling across your Excel documents by wrapping text in column headings.

It’s easy to do, takes a few seconds and improves the way you can move through and use your Excel worksheet.

Here is a worksheet where better use of column format could help.

long-headings-excel-powerpoint-courses
Long headings use loads of space and make it harder for you to navigate around your document.

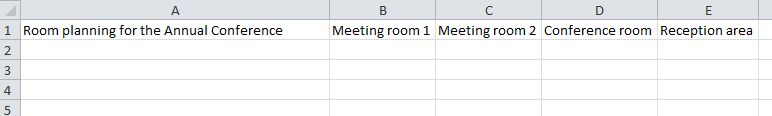
I have used autofit to make the titles fit into the columns, but the titles are taking up lots of space. There has to be a better way…oh, now wait…there is!  I can wrap the text in the column headings, so the focus is on the contents in the cell, not on the width of the column.

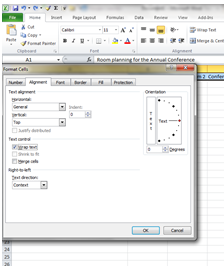
I select the entire row A1, and right click.  I then select format cells, and click Wrap Text. 

Under Text alignment, select the Vertical text box and select Top.  

format-text-excel-powerpoint-courses
Format cells options.

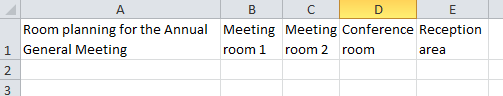
Now, for each column I can amend the column width and height manually using click and drag.

Wrap-text-excel-powerpoint-courses
Tidy!

Simple touches, like improving the look of and Excel worksheet, makes it easier to use.  If you add Excel worksheets within a Powerpoint presentation, making sure that the column headings are readable is key.  Using the wrap text option can help you do this.  You can get more out of Excel and Powerpoint, take a look at what more you can do with https://www.stl-training.co.uk/microsoft/excel-training-london.php

How to insert Excel data into a Powerpoint presentation

This is another thing I didn’t realise that Powerpoint could do.

Using my garden project presentation, I want to add a basic chart  from scratch that compares the costs of sourcing plants from a nursery, from donations or cuttings, or a combination of the two.

Luckily, Powerpoint led me through the process for adding basic information to make bar chart.

I clicked on the Insert tab and selected Chart, which is located in the Illustrations menu.

Insert-tab-bar-chart-excel-powerpoint-courses
My Excel bar chart can be created using the Insert tab, and Chart option located in the Illustrations section.

When I selected the bar chart, Powerpoint opened up an extra screen with the key headings for my chart.  I then added the data I wanted.  The chart was updated as I worked.

insert-excel-data-presentation-excel-powerpoint-training
You can work with Powerpoint and Excel side-by-side to add data to an Excel sheet. The bar chart in Powerpoint is automatically updated.
Final-chart-excel-powerpoint-courses-example
The Excel data is now in a bar chart in Powerpoint.

This is a really simple example of inserting Excel data into a Powerpoint presentation, using new data.  It’s a good start, and now I really want to build on that…time for more exploring….

For more advanced techniques in Excel and Powerpoint courses, take a look at our range of courses, from introduction, intermediate and more https://www.stl-training.co.uk/powerpoint-training-london.php and https://www.stl-training.co.uk/microsoft/excel-training-london.php


excel and powerpoint courses