MS Project 2013: View visual reports instantly in Excel or Visio

what's new in office 2013Visual reports are another fantastic way to share figures with stakeholders in way that’s digestible and easy to break down. In Project 2013, you can view specific project data in a visual report in Excel or Visio, if you have those programs installed.

How to: Select ReportsVisual Reports, select an Excel or Visio report for your project data, and click View.

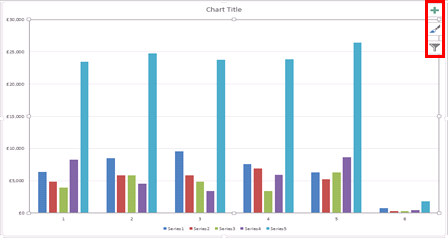
Excel builds a local Online Analytical Processing (OLAP) cube file and shows your data in an Excel PivotChart or Visio PivotDiagram. Once in Excel or Visio, you’ll be able to get the most from your data thanks to a host of new tools including recommended charts and quick analysis techniques. Reporting has never been so easy.

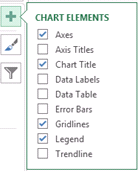
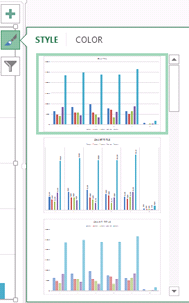
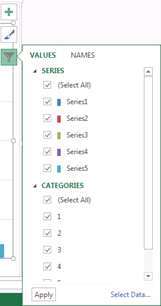
If you’re feeling adventurous, why not customise your data even further with three new tools for Excel 2013.

visual reports in ms project

Find out more great advice like this with a Best STL course on Microsoft Project training, London and UK wide.

Excel 2013: 3 New Ways To Customise Your Charts

new feature for microsoft office 2013Whether you’ve decided to use a suggested chart to represent your data or already knew which one works best from the outset, a new toolbar in Excel 2013 allow you to customise your visualisation quicker.

Selecting the chart will automatically reveal two tool ribbons: Design & Format, both specifically designed to help you manipulate your Excel 2013 charts. Although the Chart Tools Layout tab no longer exists in 2013, the buttons it contained are still available, just in different places.

Excel 2013 charts

Three (new) buttons for chart formatting now appear at the top right corner of your chart; Chart Elements, Chart Styles and Chart Filters. Instead of digging through menus you can access these buttons overlaid on the chart.

Excel 2013 charts


Chart Elements

Add or Remove specific elements of your chart such as Data Labels and Gridlines. This way you can have as much or as little labelling and layout features as you desire.

Excel Charts 2013


Chart Styles

Change the colour and style of your chart with this simple formatting option. Scroll over each option to get a preview of how your new chart will look.

Excel Charts 2013


Chart Filters

Want to modify what data the chart includes? Previously you had to modify the data range in a fiddly way. Now you can hide and show data with the chart filters selecting them from the tick box menu, very similar to filtering data in a table. Customising your charts has never been so easy.

Excel Charts 2013


For more tips and features on Excel 2013 and other versions, browse London Excel courses from STL, available London and UK wide. With training levels ranging from beginner up to advanced and Excel VBA, there’s sure to be a course to suit your needs.